
TIME TO BUCKLE UP …….And TIGHTEN THE BELT?
OUR MARKET VIEW
First things first, we need to know that in the ebb and flow of Market changes there are two broad trends, Bull Markets and Bear Markets. A Bull Market’s overall direction is UP and a Bear Market’s overall direction is Down. At Don Scholl and Associates it is our job to try to put you on the right side of these trends, we are “Dedicated to Making the Trend Your Friend”. In general, this means dedicating assets into stock when the trend is UP and it is a Bull Market, and conversely dedicating minimal assets to stock when the trend is Down and it is a Bear Market.
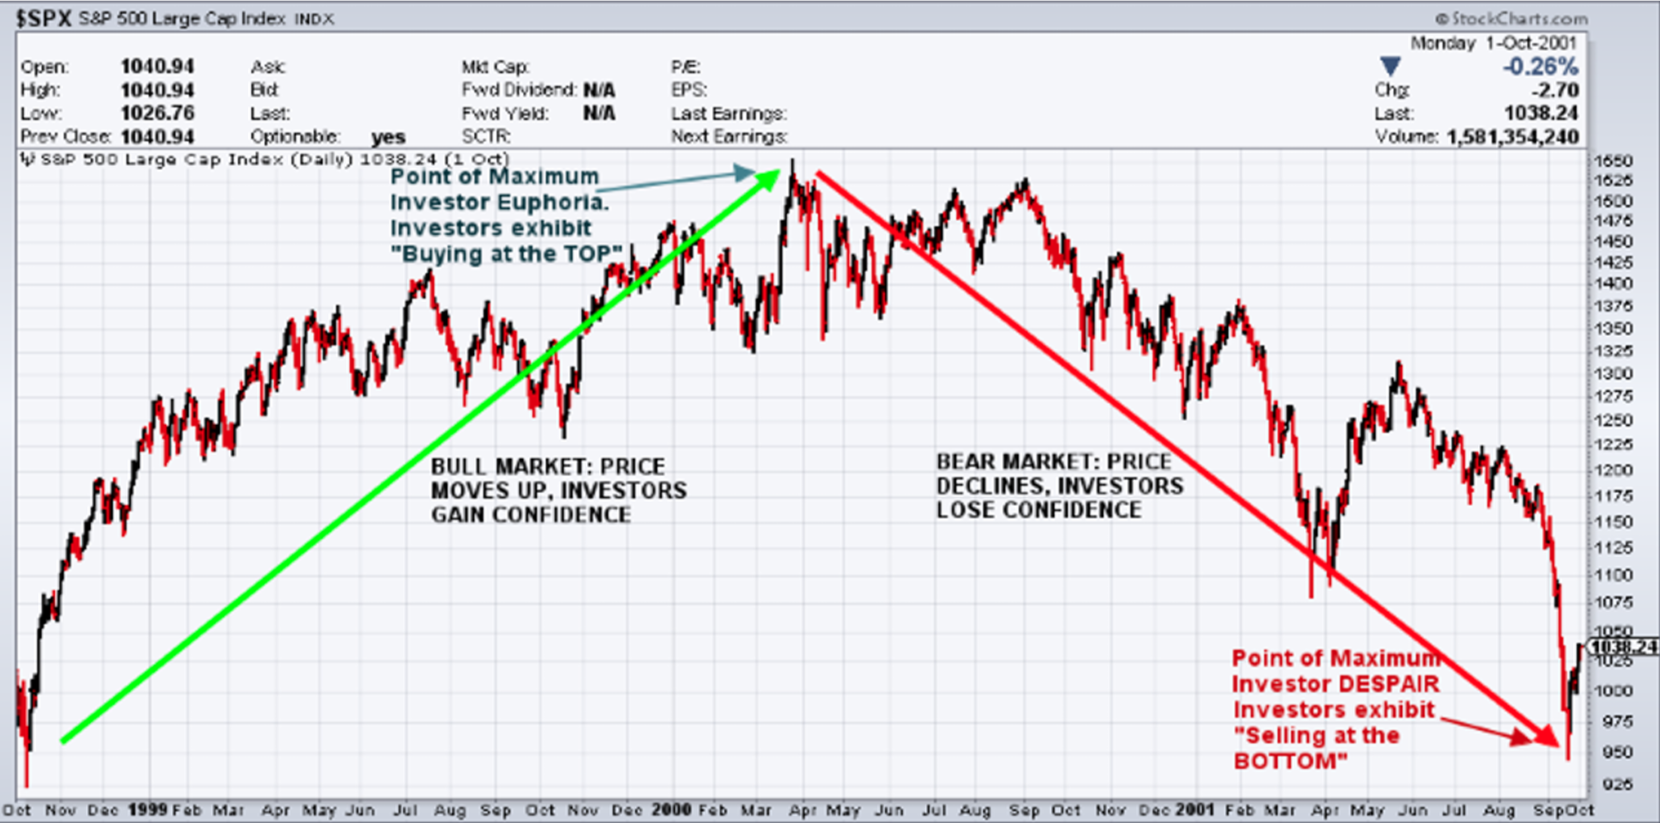
The market cycle plays on the psychology of individuals, encouraging them when prices are UP and discouraging them when prices are Down. Unfortunately for many investors, the point of maximum psychological euphoria usually marks a stock market TOP and the point of greatest psychological despair marks a stock market BOTTOM. Consequently, some investors may err, buying at Tops and selling at Bottoms. In serving you, it is our job to be mindful of market psychology, and to avoid the pitfalls of Top buying and Bottom selling.
CYCLE OF BULL AND BEAR MARKETS AND INVESTOR PSYCHOLOGY – Don’t Buy Tops and Sell Bottoms!!!
It is also important to be flexible and to avoid becoming entrenched in a particular mindset about Markets, such as “the Market keeps going down”. When a Bear Market concludes, a new Bull Market is born and this can be accompanied by rapid moves to the Upside, and you want to be ready to hop on that train before it leaves the station. That is why we actively manage at Don Scholl and Associates. We attempt to quickly adjust to Trend changes and make sure that you are on board when the Market is headed up hill.
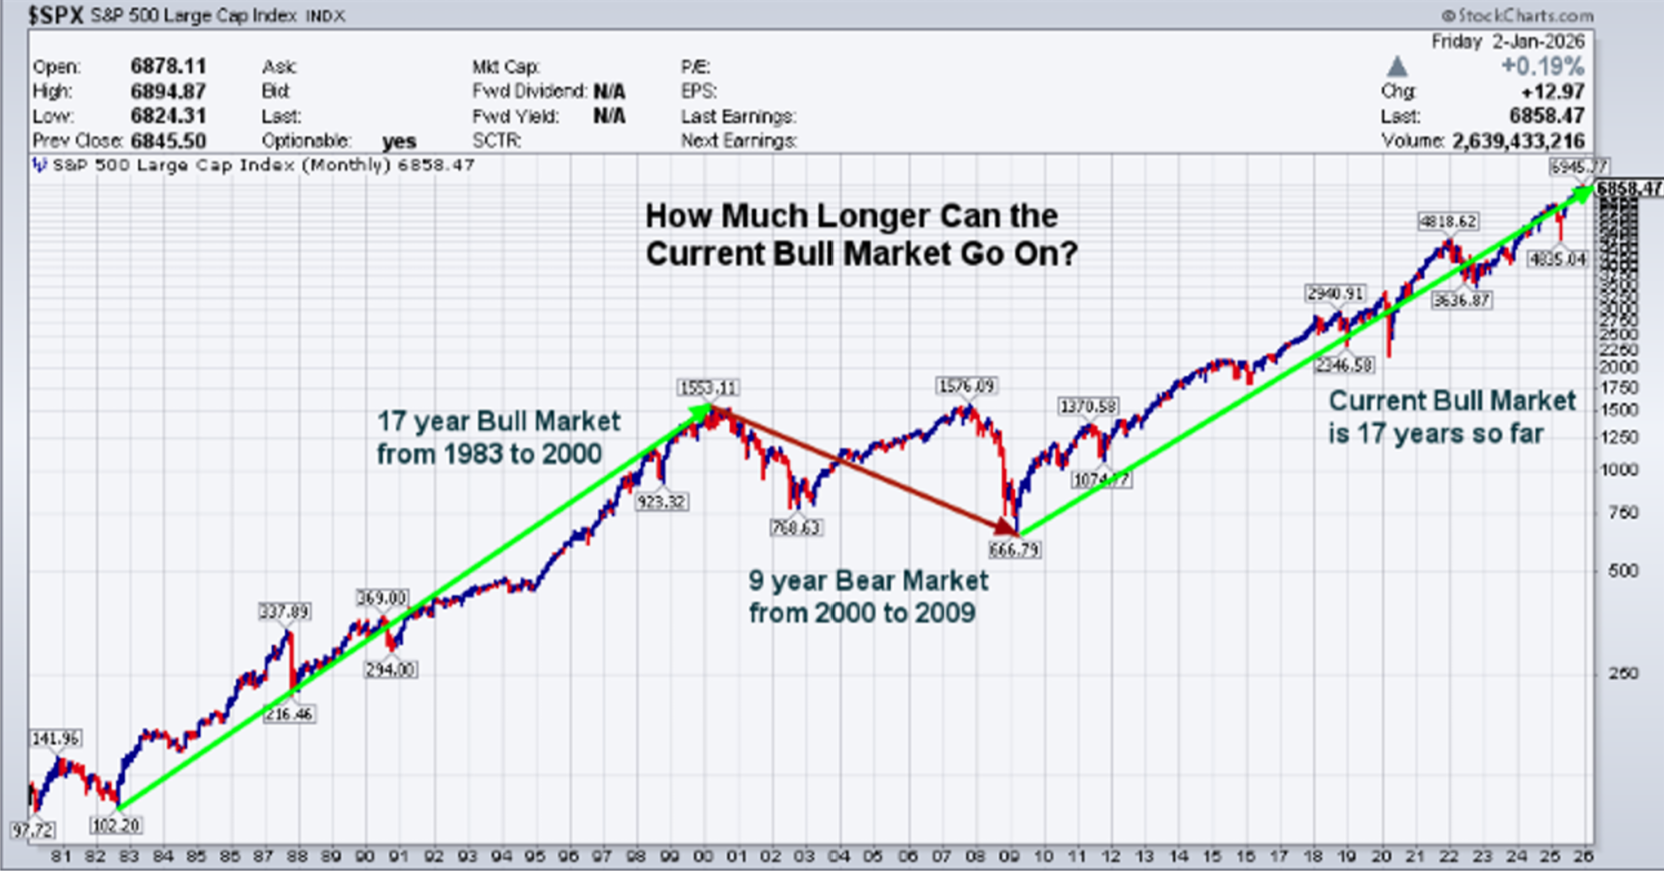
RIGHT NOW AND IN THE NEAR FUTURE it is time to buckle up and maybe even tighten the belt. As the Chart below shows, we have had an extended move UP in the Markets and it may be time to be more Cautious. The Chart below of the S&P 500 index shows a Bull Market from 1983 to 2000 (see green trend line), lasting approximately 17 years. This was followed by a grueling 9 year Bear Market which included both the DotCom Boom/Bust and the Great Recession (see red downward trend line). This Bear Market took prices down from top to bottom on the S&P 500 by nearly 60%. Following the Great Recession we have once again had 17 years of a sustained Bull Market as we enter 2026 (see green trend line). The question that we need to ask is What Happens Next? We think the Bull Market has become extended and at the very least we expect Choppy Volatile Market activity as opposed to the sustained Up movements of a strong Bull Market.
CAN THIS 17 YEAR BULL MARKET CONTINUE?
Laughing to the Bank . . . A little humor from the notoriously frugal billionaire J Paul Getty:
“Money isn’t everything, but it sure keeps you in touch with your children”.
“If you owe the bank $100, that’s your problem. If you owe the bank $100 million, that’s the bank’s problem.”
“My formula for success is rise early. work late, and strike oil.”
He seemed very aware how irony operates in parenting, finance, and fate.
When it comes to Markets and Money, we should follow Getty’s outlook and be open-minded to all possible-outcomes.
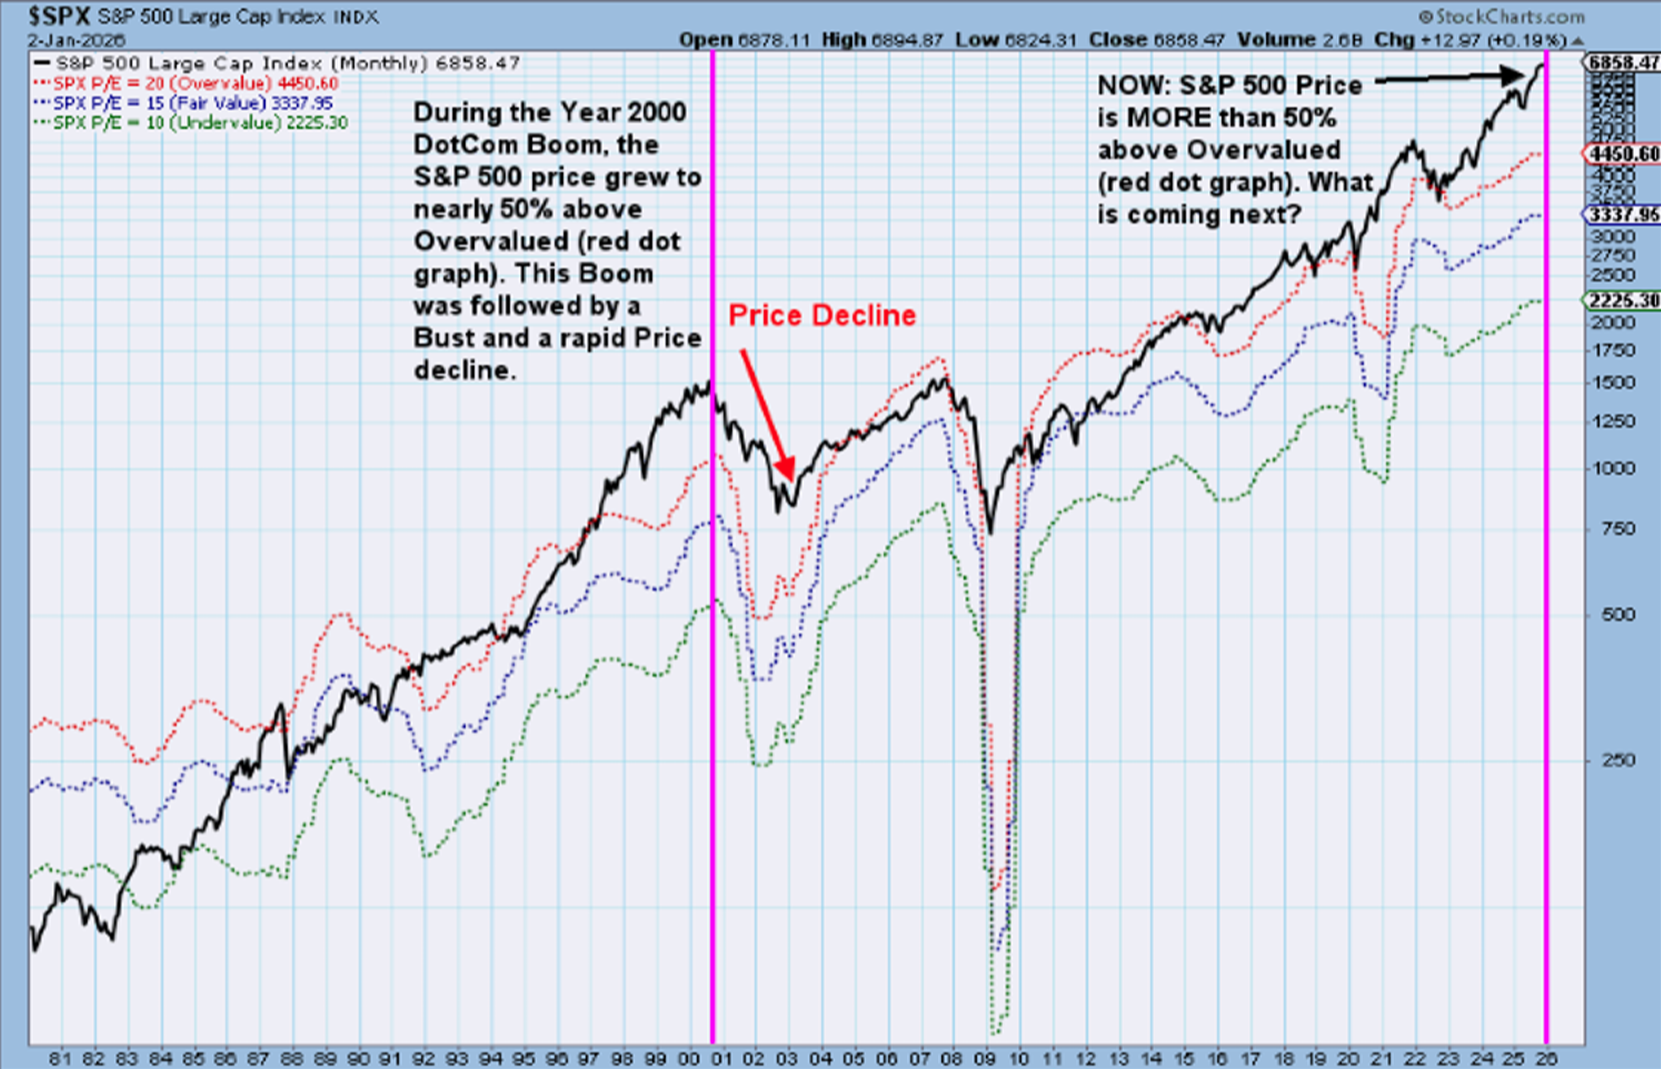
Our assessment of a possibly over-extended Bull Market is supported by the Chart below which shows over 40 years of S&P 500 price change compared to three gauges of Price: Overvalued (red dots); Fair Value (blue dots); and Undervalued (green dots). The gauge of value is based on the PRICE/EARNINGS ratio of the S&P 500 with, for example, a P/E ratio of 20 being overvalued. PRICE/EARNINGS ratio is an important fundamental measure justifying Market Price. PRICE is the price of the S&P 500 Index and EARNINGS are the cumulative earnings of each of the 500 stocks in the S&P Index.
If PRICE becomes untethered from EARNINGS then you can have a Market that is wildly overvalued or undervalued. Historically a PRICE/EARNING ratio of 15 is generally seen as Fair Value, although that is not a hard and fast rule and is dependent on the fundamentals of each Market cycle. If you take a look at the chart, you will see that much of the last 10 years we have been at or above the Overvalued gauge. However, when that has gotten to an extreme overvaluation (as noted by the vertical magenta line for the year 2000), the Market sold off rapidly for nearly three years. Using this gauge for Valuation, right NOW the Market is MORE EXPENSIVE than it was in the year 2000 just before it declined.
S&P 500 INDEX MAY BE MORE EXPENSIVE NOW THAN AT THE TOP OF THE DOTCOM BOOM/BUST
What is an Investor to do??? There are many options that can potentially do well during price declines in the S&P 500 Index. We utilize a wide array of investments that range from Treasury bonds, to Corporate Bonds, to Commodities, to Precious Metals, and to Hedge Funds (that are typically structured to take advantage of both up and down markets) to mitigate against losses in stock values.
HOW ABOUT THE AI BOOM? WILL THE STOCK MARKET CONTINUE TO RISE AS THE AI BOOM UNFOLDS? Many compare the AI Boom to the DotCom Boom. There is a common pattern in most Technological revolutions, be it Railroads, Refrigeration, or the Internet. We never know for sure how much change or profit a new Technology can bring, consequently expectations and prices can become exaggerated at first. In the DotCom boom there was a Bubble in the Nasdaq that deflated by 80% when it burst. Nevertheless, the DotCom revolution has caused profound changes in society and economies, and highly profitable companies have emerged over time. The ultimate beneficiaries of a revolution are not always known at the beginning and sometimes the greatest beneficiary of a technology is in an allied industry – so in the case of the emergence of Refrigeration the main beneficiaries were not refrigerator companies but rather Coca Cola. Likewise, the stock market advance associated with the AI Boom may take a rest for a while, but as AI technology matures and its potential is more clearly realized, the companies that become preeminent in AI, and allied industries, may become highly profitable. It just may take some years to unfold.
Don Scholl is a Financial Planner with Don Scholl and Associates, Inc. a registered investment advisor not affiliated with OsaicWealth. He also offers securities as a Registered Representative of OsaicWealth , Inc. Member of FINRA/SIPC. OsaicWealth is separately owned and other entities and/or marketing names , products or services referenced here are independent of OsaicWealth. Note: The views stated in this letter are not necessarily the opinion of Don Scholl and Associates, Inc., or OsaicWealth, Inc., and should not be construed, directly or indirectly, as an offer to buy or sell any securities mentioned herein. Investors should be aware that there are risks inherent in all investments, such as fluctuations in investment principal. With any investment vehicle, past performance is not a guarantee of future results. Material discussed herewith is meant for general illustration and/or informational purposes only, please note that individual situations can vary. Therefore, the information should be relied upon when coordinated with individual professional advice. This material contains forward looking statements and projections. There are no guarantees that these results will be achieved. There is no guarantee that a diversified portfolio will outperform a non- diversified portfolio in any given market environment.Due to volatility within the markets mentioned, opinions are subject to change without notice. Information is based on sources believed to be reliable; however, their accuracy or completeness cannot be guaranteed. All indices referenced are unmanaged and cannot be invested into directly. Unmanaged index returns do not reflect fees, expenses, or sales charges. Index performance is not indicative of the performance of any investment. Past performance is no guarantee of future results. The Standard and Poors 500 index is a capitalization weighted index of 500 stocks designed to measure performance of the broad domestic economy through changes in the aggregate market value of 500 stocks representing all major indices. The Dow Jones Industrial average is comprised of 30 stocks that are major factors in their industries and widely held by individuals and institutional investors.